
The 5 Numbers Every Nonprofit Should Check Before Building a Fall Plan
There's a quiet moment in every fundraising office around mid-May. The spring appeal is in the mail. The board meeting is behind you. Summer hasn't quite arrived. And for the first time since January, you have an hour to think.
Most teams use that hour to catch up on email.
The teams that don't — the ones who pull up their CRM and actually look at five specific numbers — go into their fall season with a clear picture of what they're walking into. The ones who don't catch up on email are flying blind until November, when there's nothing left to fix.
Here's the thing about fundraising data: it's only useful if you can still act on it. A retention dip you spot in May is fixable. The same dip spotted in December is a year-end fundraising report you'd rather not write. A lapsed donor identified in May can be back on the file by GivingTuesday. The same donor identified in January is just a number in a year-over-year comparison.
This is the mid-year check that pays for itself by October. Five numbers, a benchmark for each, and what to do if yours is off.
1. Donor retention rate, year-to-date
What to pull: The percentage of donors who gave in 2025 and have given again so far in 2026.
What good looks like: The Fundraising Effectiveness Project's most recent data puts overall retention at roughly 26 to 32 percent at the midyear mark, depending on the quarter and methodology. Bloomerang's annual benchmark puts the full-year sector average closer to 43 percent. Top-quartile organizations land between 60 and 70 percent. Pay attention to the trend more than the absolute number — if your retention is improving year over year from your own baseline, you're doing the work right.
What to do if it's off: The single biggest lever is your first-90-day donor experience. "New donor retention is sitting at 14 percent sector-wide, which means roughly six in seven first-time donors never give a second gift." The fix isn't a campaign — it's a sequence. A thank-you within 48 hours. An impact update within 30 days. A second touchpoint that isn't an ask within 90 days. If you can build that sequence in May, you'll see it in your fall numbers.
2. Lapsed donors by tier
What to pull: Not just total lapsed donors, but lapsed donors broken out by their last gift level — under $100, $100 to $499, $500 to $999, $1,000 to $4,999, and $5,000+.
What good looks like: This is less about a target number and more about understanding the shape of your lapse. Losing twenty $25 donors and losing one $2,500 donor are completely different problems requiring completely different responses. Most CRMs can produce this view as a saved search; if yours can't, that's its own data point.
What to do if it's off: For lapsed donors at the $500+ tier, run the multi-year rhythm test before you assume they're truly lapsed. Pull a list of donors who gave three or more times in the past five to seven years but didn't give last year. That segment is "loyal but skipped" — they need a stewardship touch, not a reactivation appeal. Industry data shows nonprofits recapture only 2 to 4 percent of lapsed donors each year, but reactivation costs 3 to 5 times less per dollar raised than acquisition. The lapsed file is one of your highest-ROI fundraising sources, and most organizations leave it largely untouched.
3. Average gift size by channel
What to pull: Year-to-date average gift broken out by direct mail, email, online (unsolicited), events, and major gifts.
What good looks like: What matters here is direction, not the absolute number. If your direct mail average gift is down 15 percent year over year and you're planning the same fall mailing volume, you have a budget problem you don't know about yet. The 2026 M+R Benchmarks reported that nonprofits raised an average of $2.40 per email subscriber in 2025, up from $1.87 the year before — but the same study warned that much of last year's revenue surge came from one-time crisis-driven gifts that may not repeat. Your own channel-by-channel data is the only reliable predictor of what your fall will actually look like.
What to do if it's off: Two questions. First, has your donor mix shifted? A drop in average gift often reflects a healthier acquisition pipeline (more entry-level donors) rather than a problem with existing donors. Second, has your ask string shifted? Many nonprofits inherited a $25/$50/$100/$250 ask string years ago and never revisited it. If your average gift is climbing, your ask string is probably suppressing it.
4. Recurring giving net change
What to pull: New monthly donors acquired year-to-date, minus monthly donor cancellations and failed payments.
What good looks like: A positive number. The 2026 M+R Benchmarks reported that monthly giving accounted for 27 percent of all online revenue in 2025, with monthly giving revenue growing 12 percent year over year. If your monthly program is shrinking in net donors even as monthly revenue holds steady, you're masking an attrition problem with upgrades from existing sustainers.
What to do if it's off: The two highest-leverage fixes are a credit card updater (most CRMs and payment processors offer this — it can recover 5 to 15 percent of "lost" monthly donors automatically) and a sustainer welcome series. A new monthly donor who hears nothing for three months after their first gift is twice as likely to cancel as one who gets a structured onboarding sequence.
5. First-time donor count and conversion rate
What to pull: Number of first-time donors year-to-date, plus what percentage of last year's first-time donors have given again so far this year.
What good looks like: New donor counts have been declining sector-wide for five consecutive years. According to FEP data, donor counts fell 3.6 percent in 2025, with the steepest drops among microdonors (under $100). The top-quartile benchmark for first-to-second gift conversion is in the 30 to 40 percent range. Sector average sits in the 14 to 20 percent range.
What to do if it's off: First-time donor count is largely an acquisition problem (fix your top of funnel — events, paid digital, peer-to-peer). First-to-second gift conversion is a stewardship problem (fix your welcome series). Confusing the two is the single most expensive mistake fundraising teams make. If you have a healthy first-time donor count but low conversion, throwing more money at acquisition makes the problem worse.
Putting it together
The point of these five numbers isn't to grade your year-to-date performance. It's to surface the one or two issues that, if you fix them in May, will materially change your November.
For most organizations, that's not five problems. It's one. Maybe two. Your retention is fine but your monthly program is quietly shrinking. Your monthly program is healthy but your $500+ donor tier has lapsed at twice the rate it usually does. Your lapsed file looks normal but your first-time donor count is down 30 percent and your fall renewal universe is about to reflect that.
You won't know which one it is until you pull the numbers.
A 30-minute version of this
If you have an hour, run all five reports, write down the variances, and pick the one or two to act on this summer.
If you only have 30 minutes:
Pull your year-to-date retention rate and compare it to the same date last year.
Pull your monthly donor net change for the year.
Pick whichever number has moved the most and walk down to your director's office to talk about it.
That conversation, in May, is worth more than the same conversation in November. By November there's nothing left to do but write it up.
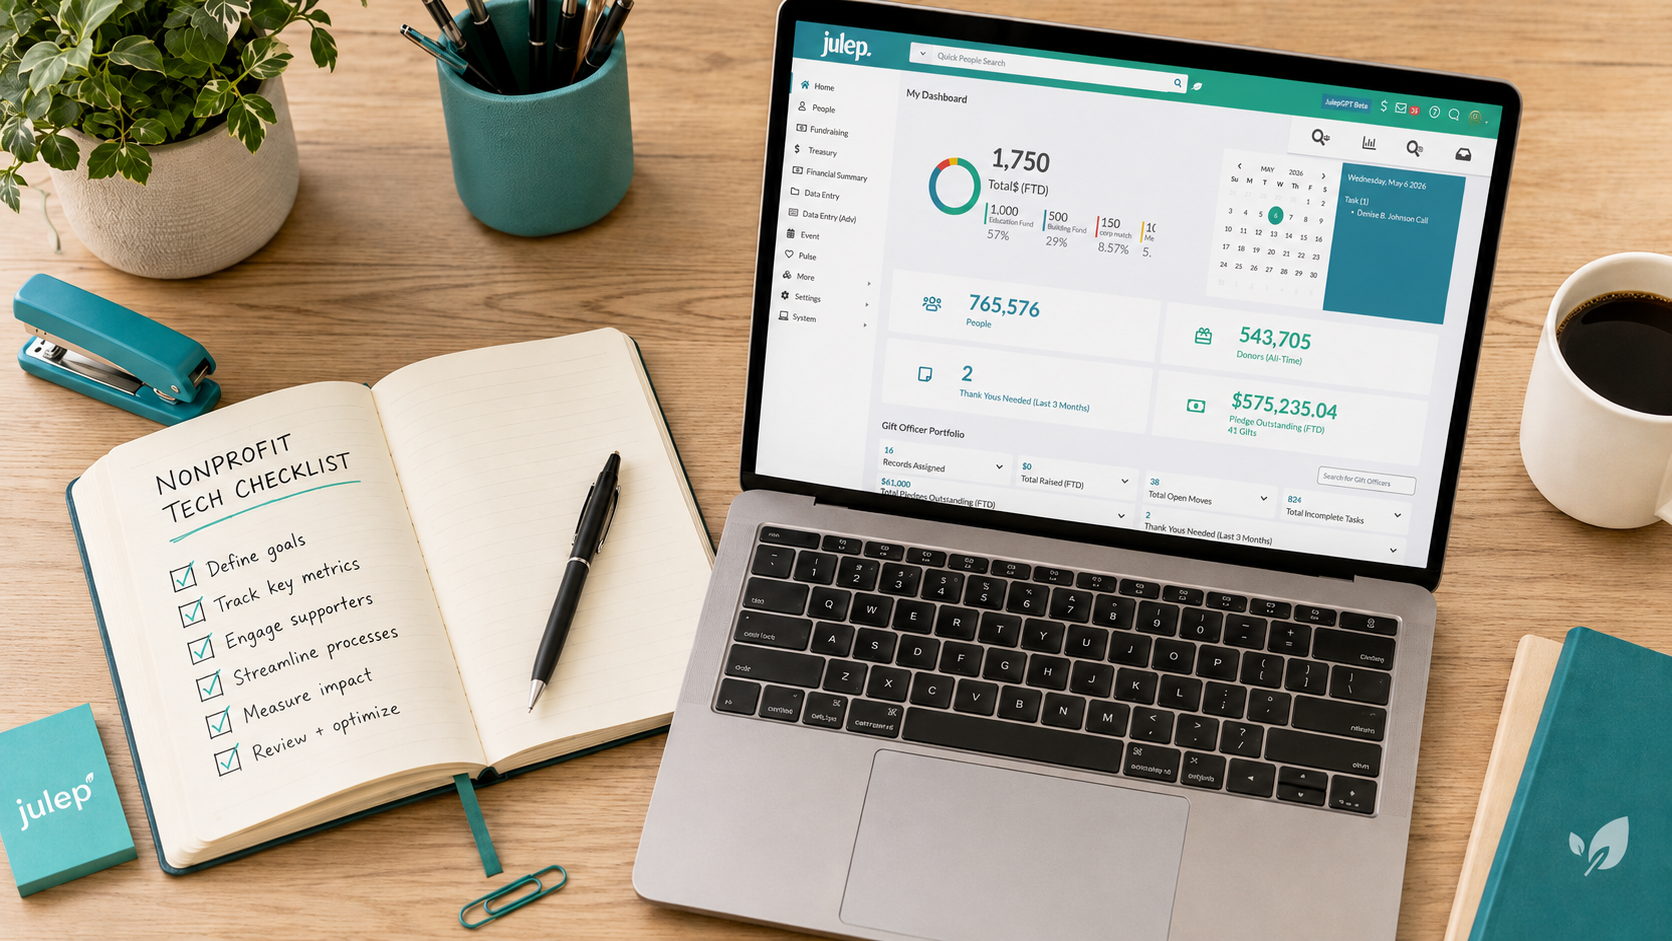
Want to run these five reports in five minutes instead of five hours? Julep's saved searches and reporting dashboards let you build each of these as a recurring report that lands in your inbox every month.
See how Julep's reporting works →